Most traders think you need to be right 90% of the time to make money. This chart proves that’s a lie.
The Breakdown
-
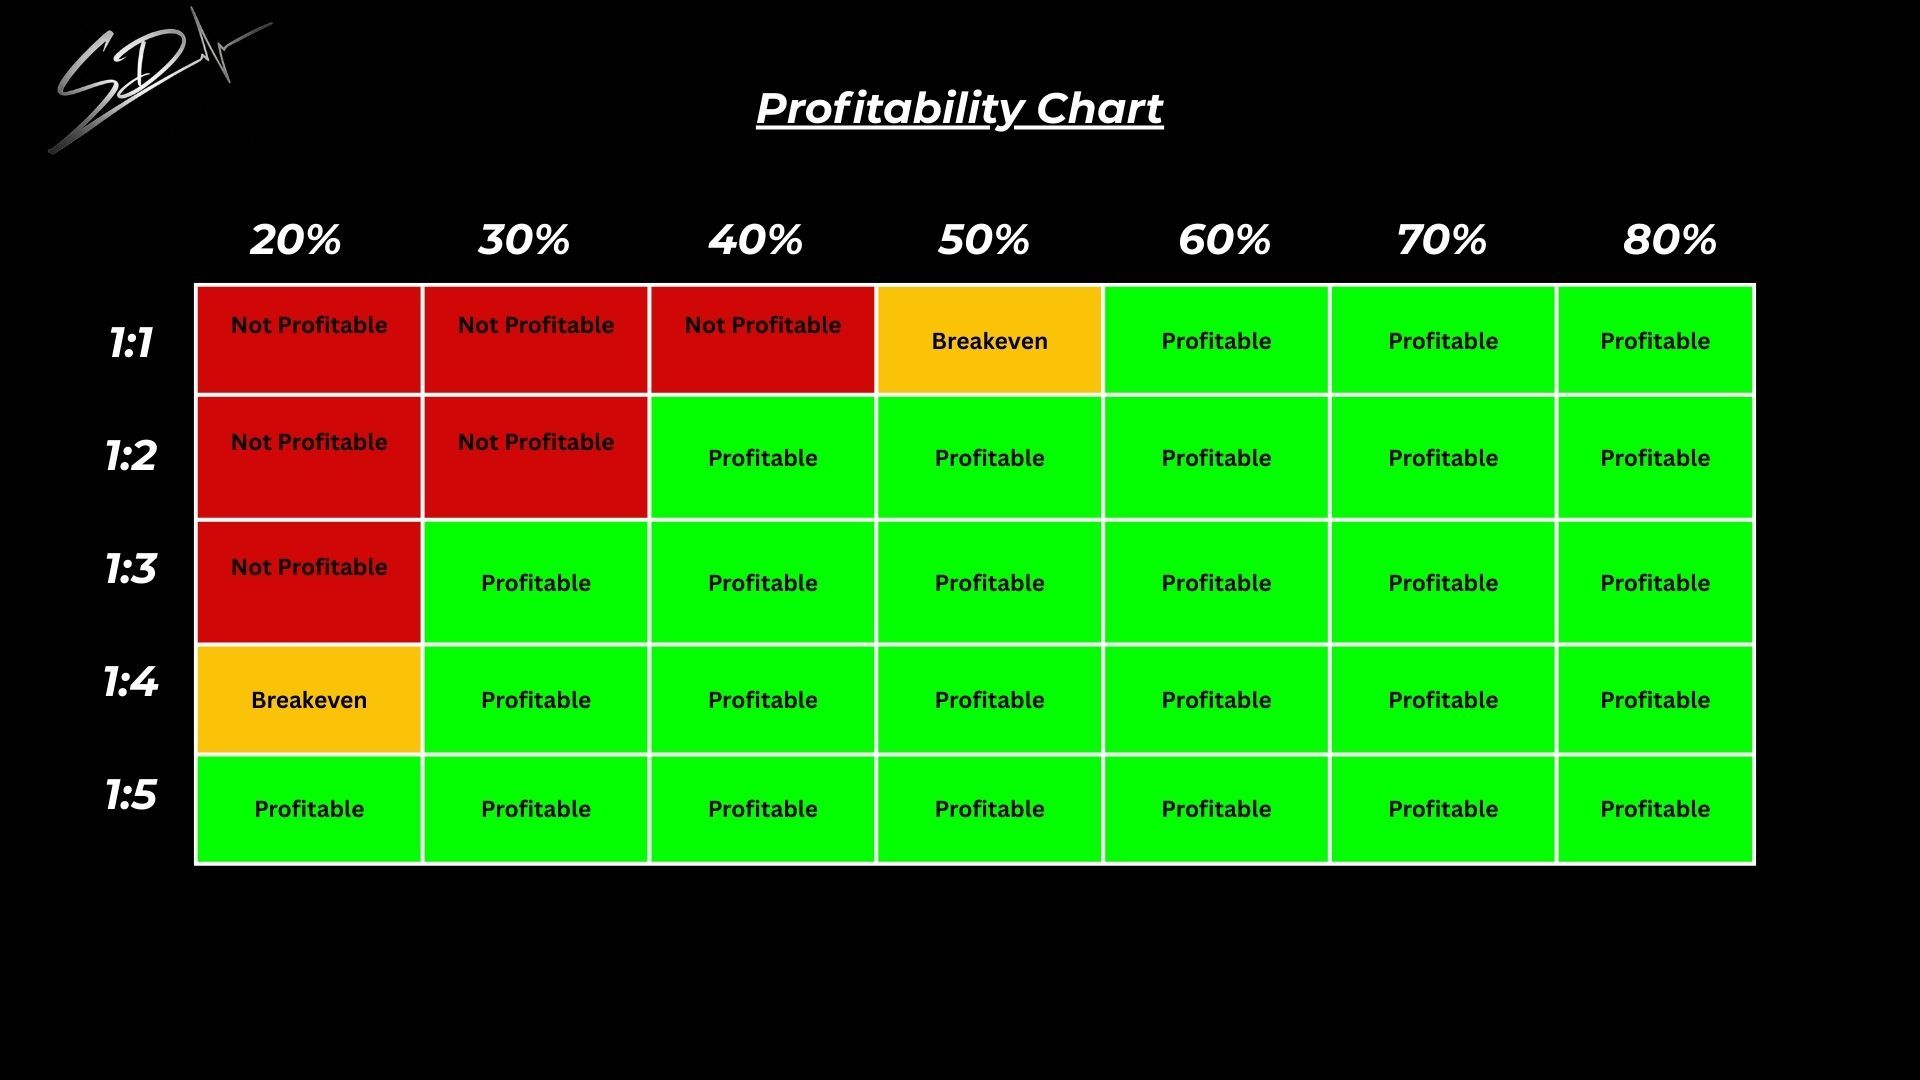
Red (Not Profitable): You’re losing more than you’re making. Your strategy or your math is broken.
-
Yellow (Breakeven): You’re spinning your wheels. You aren't losing money, but you aren't growing.
-
Green (Profitable): This is the "Sweet Spot." This is where wealth is built.
The Big Takeaway
Look at the 1:5 ratio at the bottom. It shows that if you manage your risk properly, you can lose 80% of your trades and still be profitable.
Stop trying to be "right" and start being mathematical. If you can master a high RR, you don't need a perfect win rate to change your life.