MASTERING LIQUIDITY & THE ORDER BOOK

Scroll down for notes
Liquidity is what actually moves the market. It’s all the buy and sell orders sitting in the market, waiting to be filled.
The big players need those orders to fill their huge trades, so price is always being drawn towards liquidity, and every high or low it takes out happens for a reason.
Before you can trade it properly, you need to understand how the order book works, where liquidity sits on your chart, and why price takes out highs and lows before it makes the real move.
With this in place, you’ll stop being the trader who gets stopped out right before price goes your way, and you’ll know exactly where price is likely to go next every time you open a chart.

What Is Liquidity
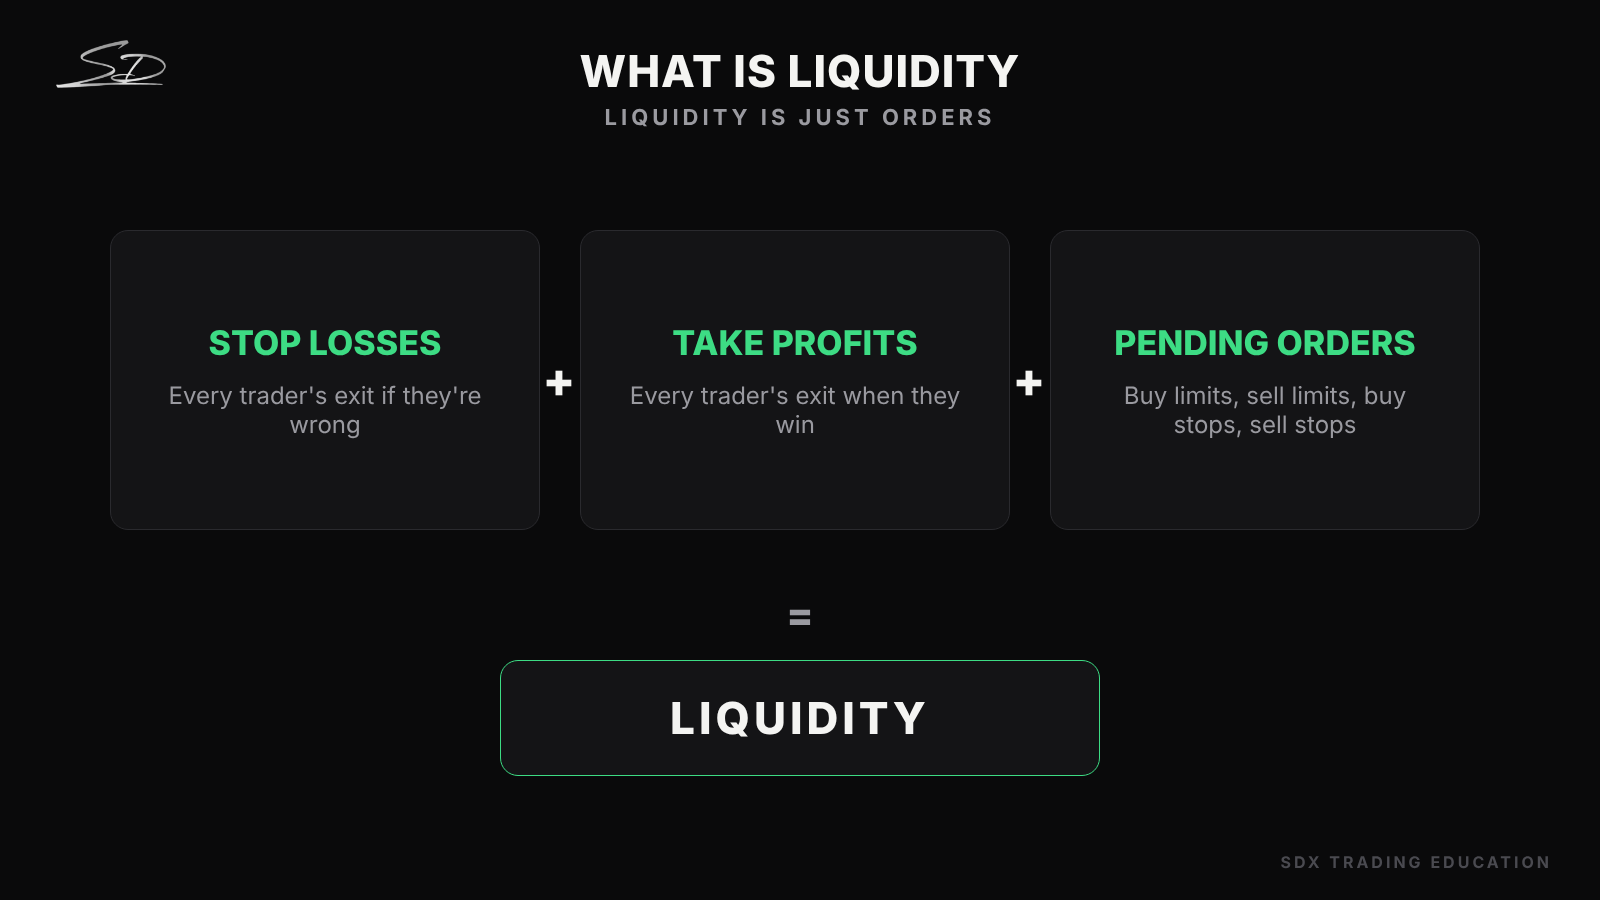
Liquidity is just orders. It’s every stop loss, every take profit and every pending order sitting in the market, waiting to be filled.
Every time a trader places a trade, they leave orders behind them. Times that by every trader in the world and you get millions of orders sitting at different prices.
When lots of those orders are bunched up at the same price, there’s a lot of liquidity there.
Price is drawn to where the orders are.
The Order Book
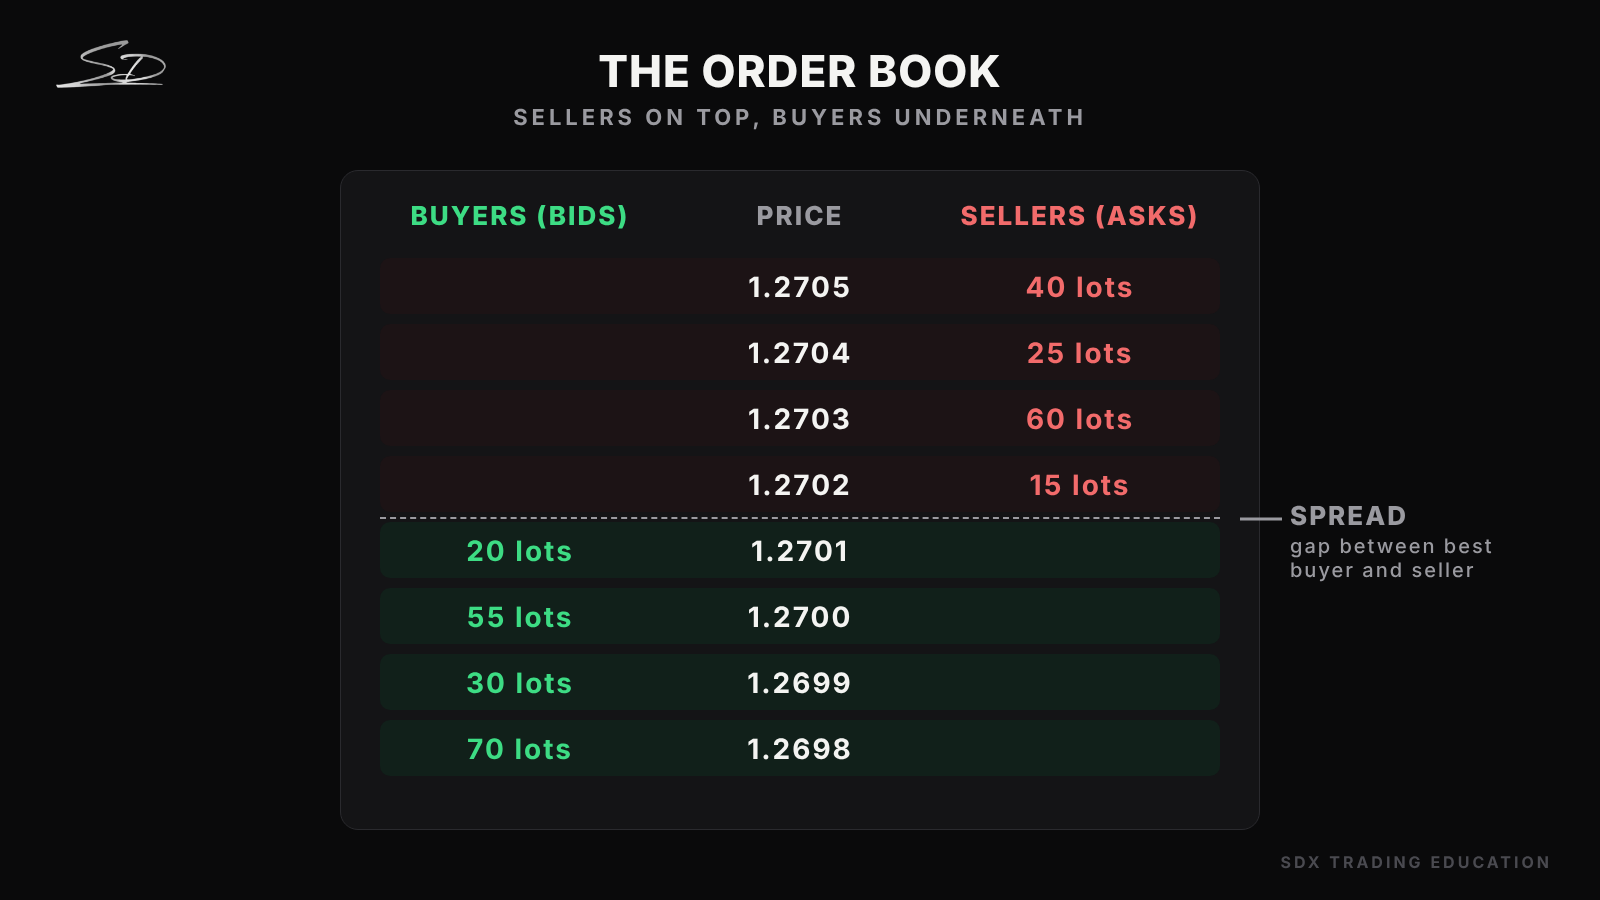
The order book is a live list of every order in the market. Think of it like a queue of buyers on one side and a queue of sellers on the other.
Sellers (asks) sit above price, because they want to sell higher. Buyers (bids) sit below price, because they want to buy lower.
The gap between the best buyer and the best seller is the spread. That’s the broker’s cut, and it’s why every trade starts slightly in minus.
When you click buy, you buy from the cheapest seller. When you click sell, you sell to the highest buyer.
How Price Moves
Price doesn’t move on its own. It moves because of the order book.
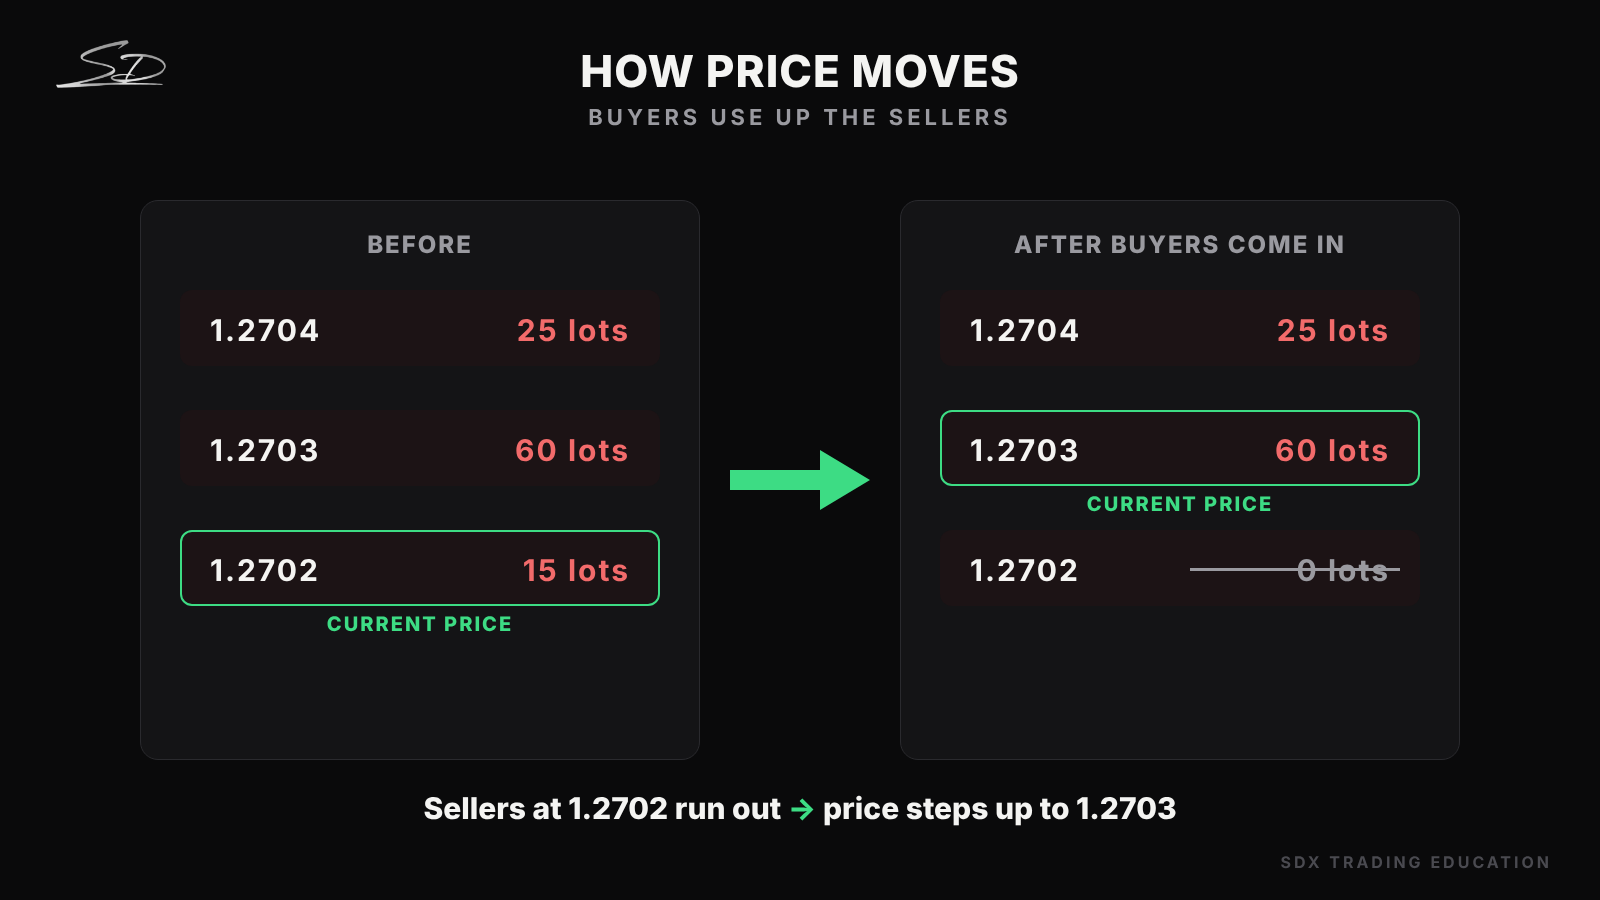
When buyers come in, they fill against the cheapest sellers first. In this example, there are only 15 lots for sale at 1.2702.
Once those 15 lots are gone, there’s nobody left selling at that price. So price has no choice but to step up to the next seller at 1.2703.
Every candle on your chart is just this happening over and over, really fast.
The Big Player Problem
The big players are the banks, hedge funds and institutions. Their orders are huge.
A bank wanting to buy 5,000 lots can’t just press buy when only 15 lots are for sale. They’d eat through the whole order book, push price up against themselves and end up with a terrible price.
What they need is a big pile of orders all in one place, so they can fill their whole position in one go.
And the biggest piles of orders sit exactly where everyone puts their stop losses.

Where The Orders Sit
Think about where most traders put their stops.
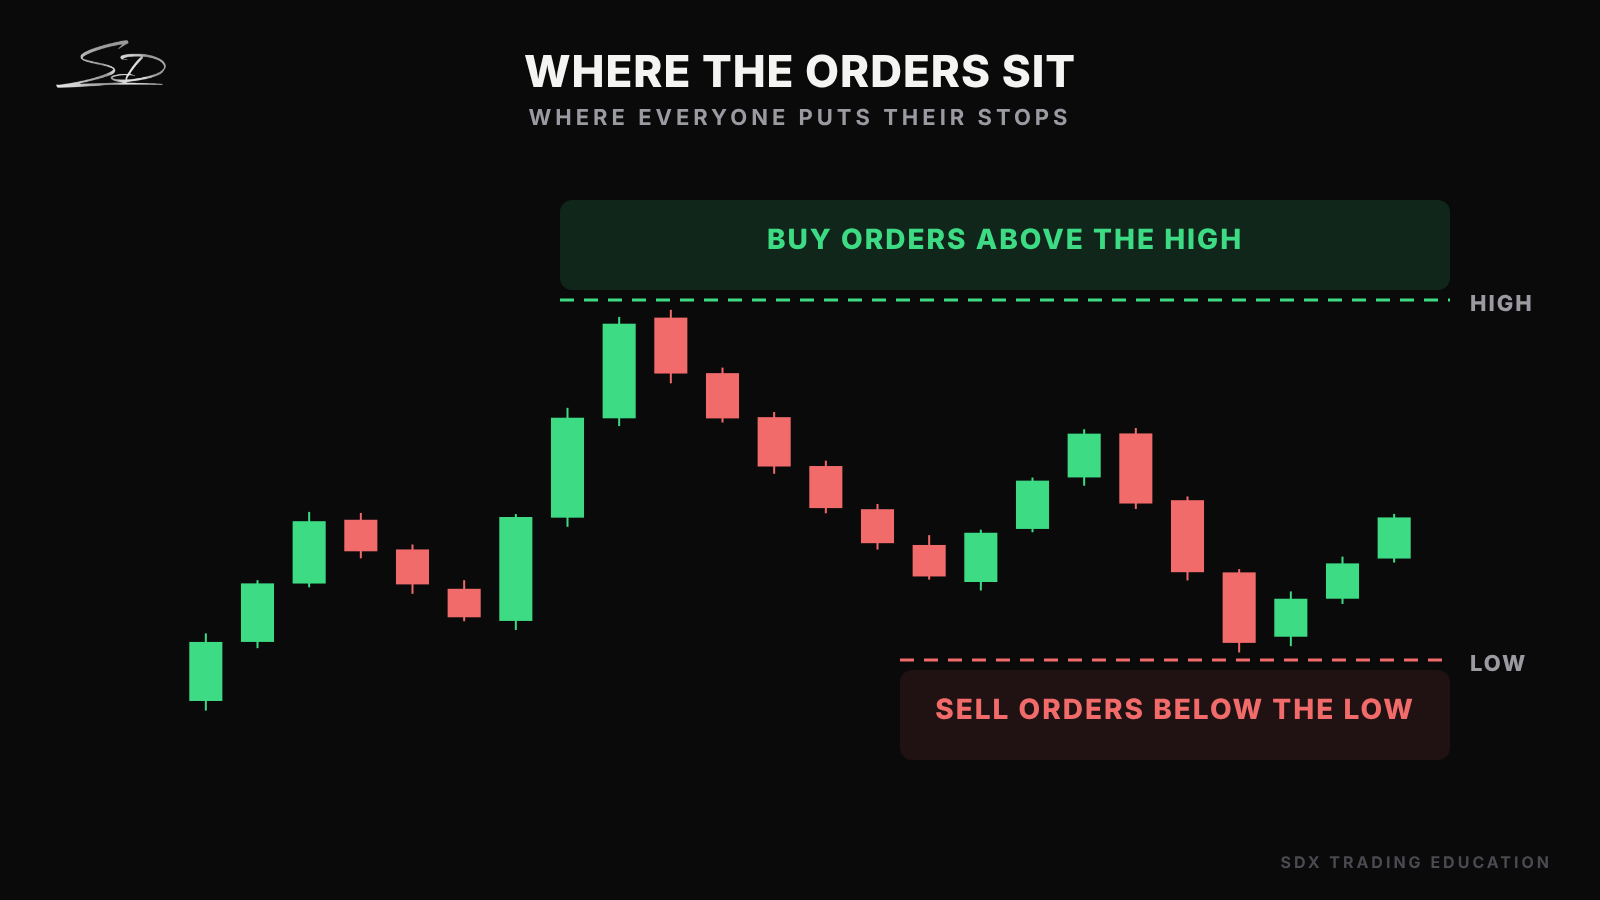
Sellers put their stop loss just above the high. Breakout traders wait above the high to buy. So above every obvious high, there’s a big pile of buy orders.
Buyers put their stop loss just below the low. Breakout traders wait below the low to sell. So below every obvious low, there’s a big pile of sell orders.
A stop loss on a sell turns into a buy when it’s hit. A stop loss on a buy turns into a sell.
Buy Side Liquidity
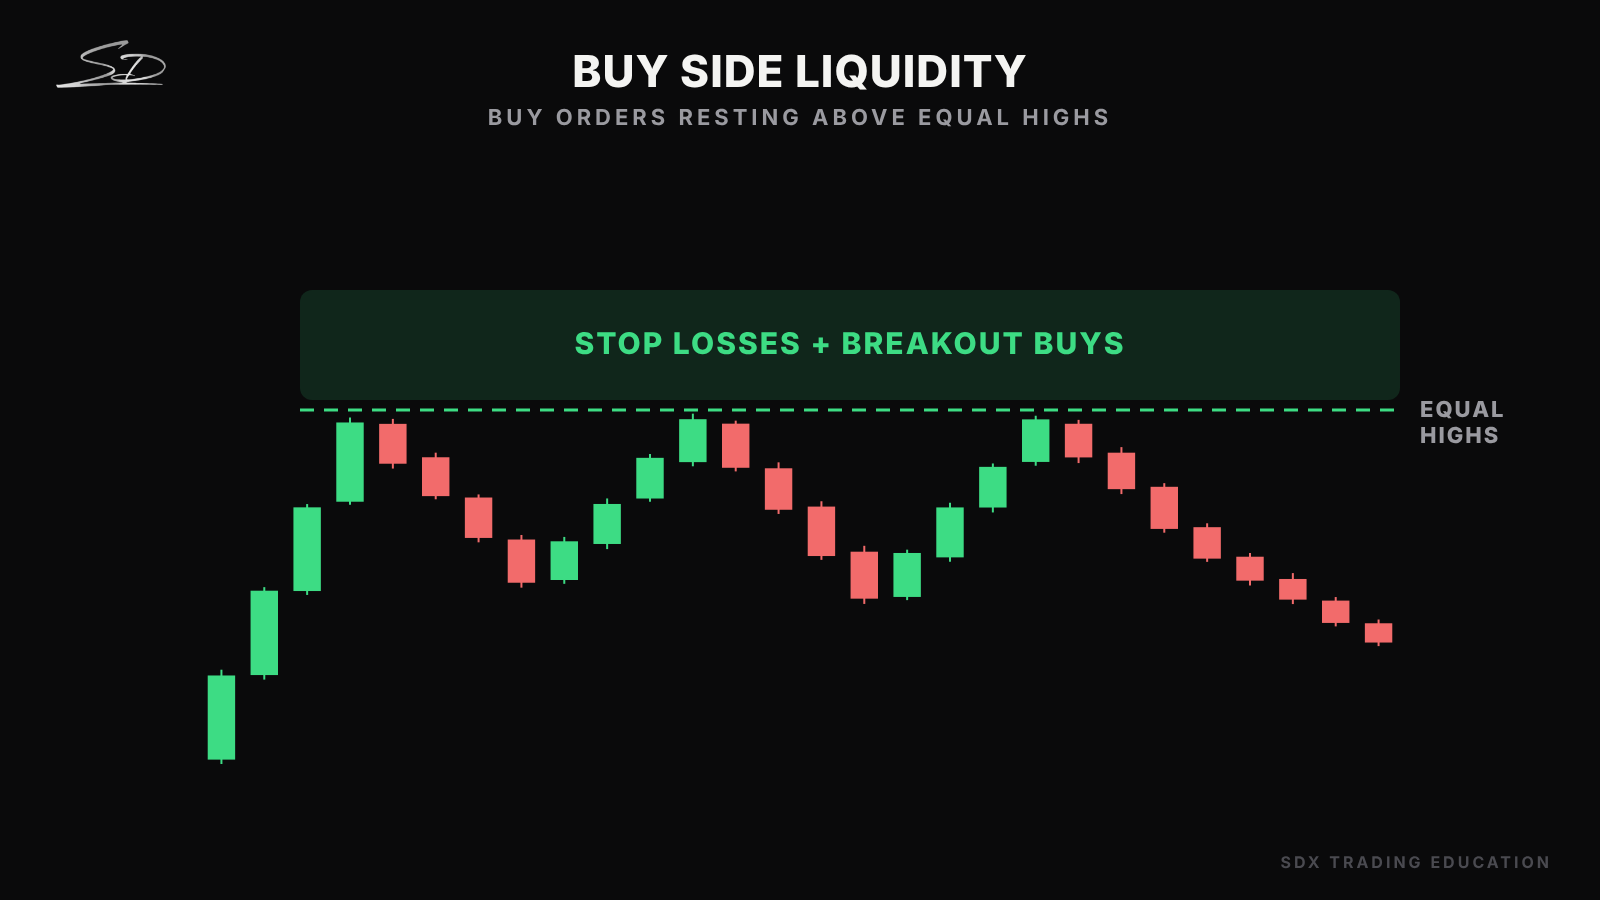
When price hits the same high again and again, we call these equal highs.
Beginners see this and think it’s resistance, so they sell, with their stop loss just above. Breakout traders are also sat above, waiting to buy the moment it breaks.
That leaves a huge pile of buy orders resting above the equal highs. This is buy side liquidity.
To the big players, equal highs aren’t resistance. They’re a target.
Sell Side Liquidity
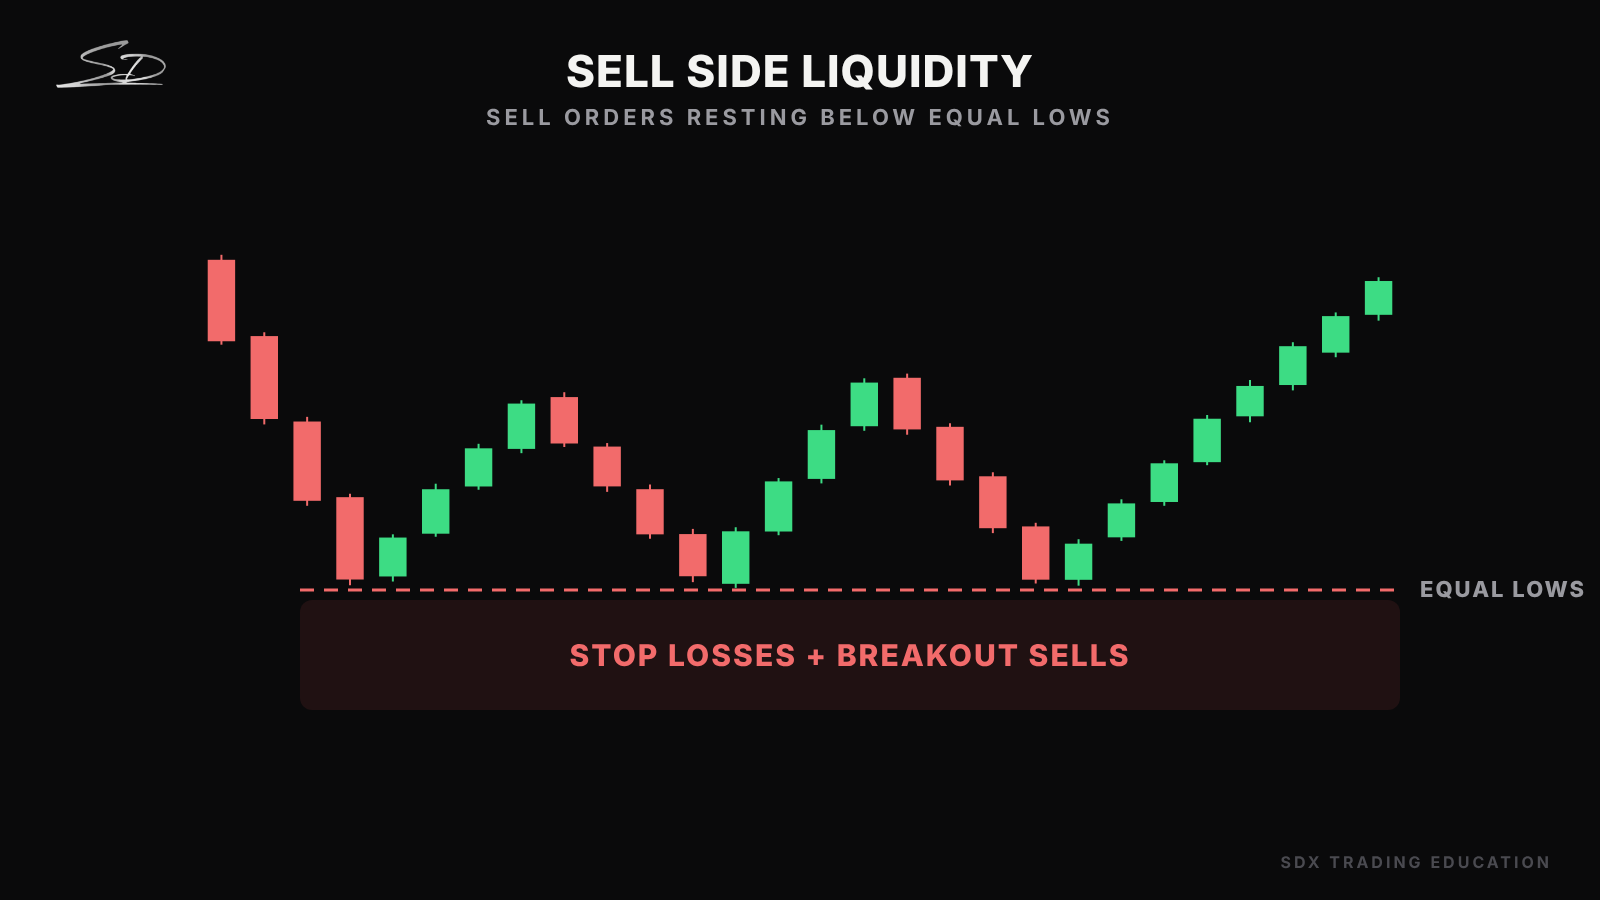
This is the same thing flipped upside down. When price keeps bouncing off the same low, we call these equal lows.
Beginners see this and think it’s support, so they buy, with their stop loss just below. Breakout traders are sat below, waiting to sell the moment it breaks.
That leaves a huge pile of sell orders resting below the equal lows. This is sell side liquidity.
To the big players, equal lows aren’t support. They’re a target.
Where To Look For It
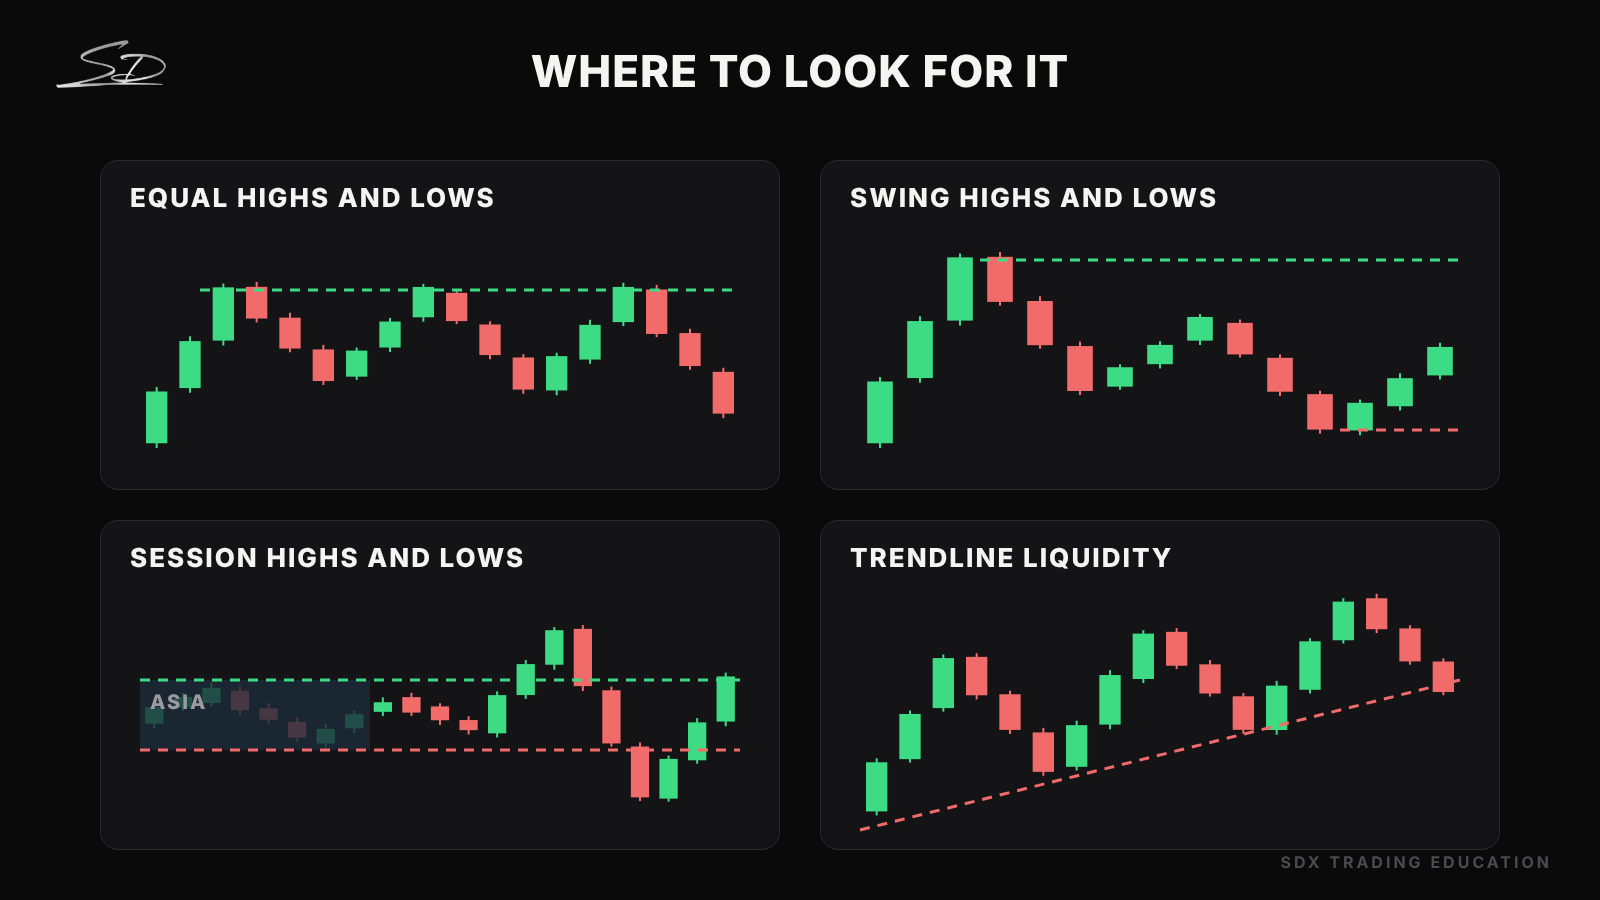
There are four main places liquidity builds up on your chart:
Equal highs and lows -> the cleanest liquidity there is, because everyone can see them
Swing highs and lows -> any clear turning point where price changed direction
Session highs and lows -> the Asia high and low, the London high and low, and the previous day’s high and low
Trendlines -> every touch builds more stops underneath
The more obvious the level, the more stops are sitting there.
The Liquidity Sweep
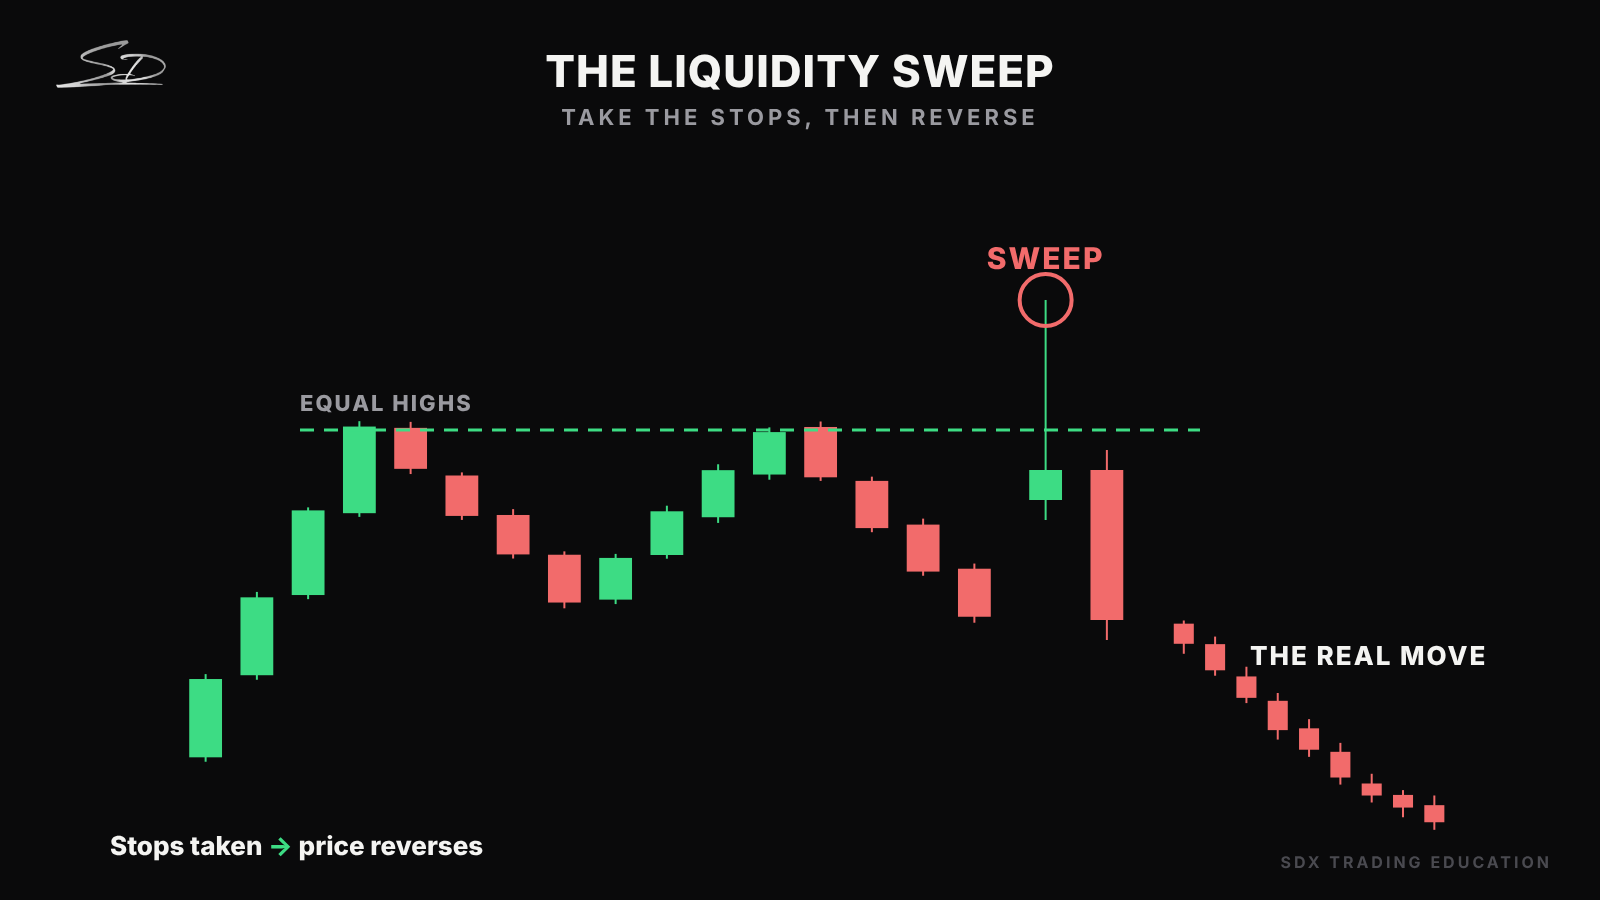
This is what it looks like when price goes and takes the liquidity.
Price spikes through the equal highs. All the sellers get stopped out and all the breakout buyers jump in, thinking it’s about to fly.
That’s a massive rush of buy orders all at once, and it’s exactly what the big players were waiting for. They use those orders to fill their sells.
Then price reverses and drops hard. That drop is the real move.
It’s not personal. The market just needed those orders.
Don’t Be The Liquidity
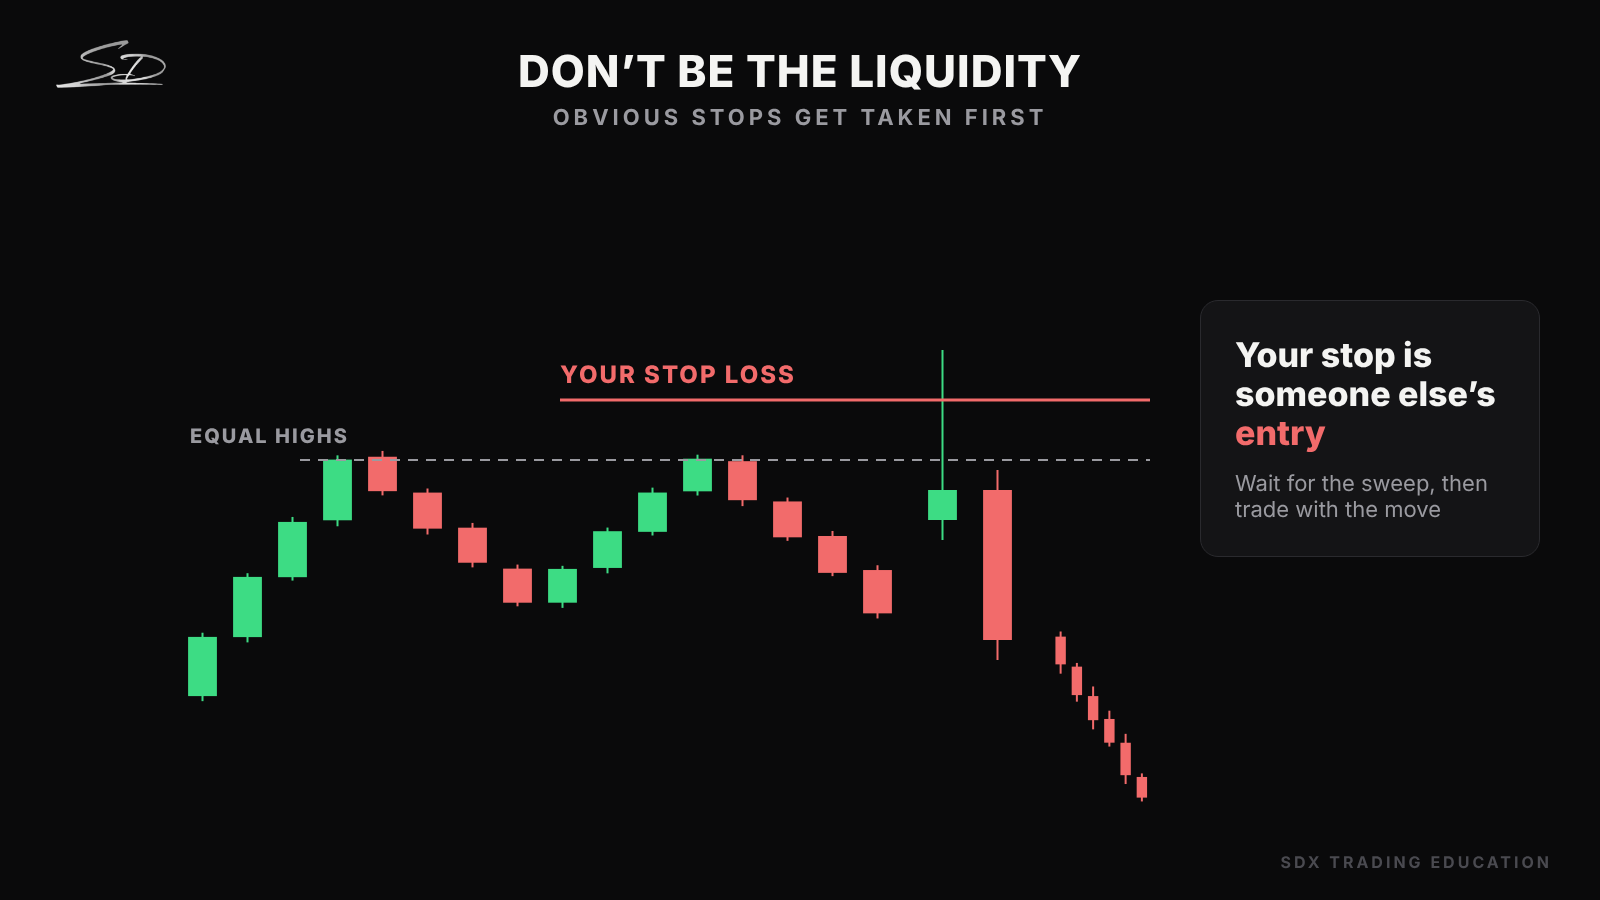
Most traders lose for a really simple reason. They put their stop loss in the most obvious place on the chart, the same place as everyone else.
That’s exactly where the big players go to collect orders. Your stop loss is someone else’s entry.
Once you understand this, you stop jumping in at the obvious levels. You wait for the liquidity to be taken first, and let everyone else get stopped out.
Then you trade with the big players, not against them.
Where Liquidity Fits
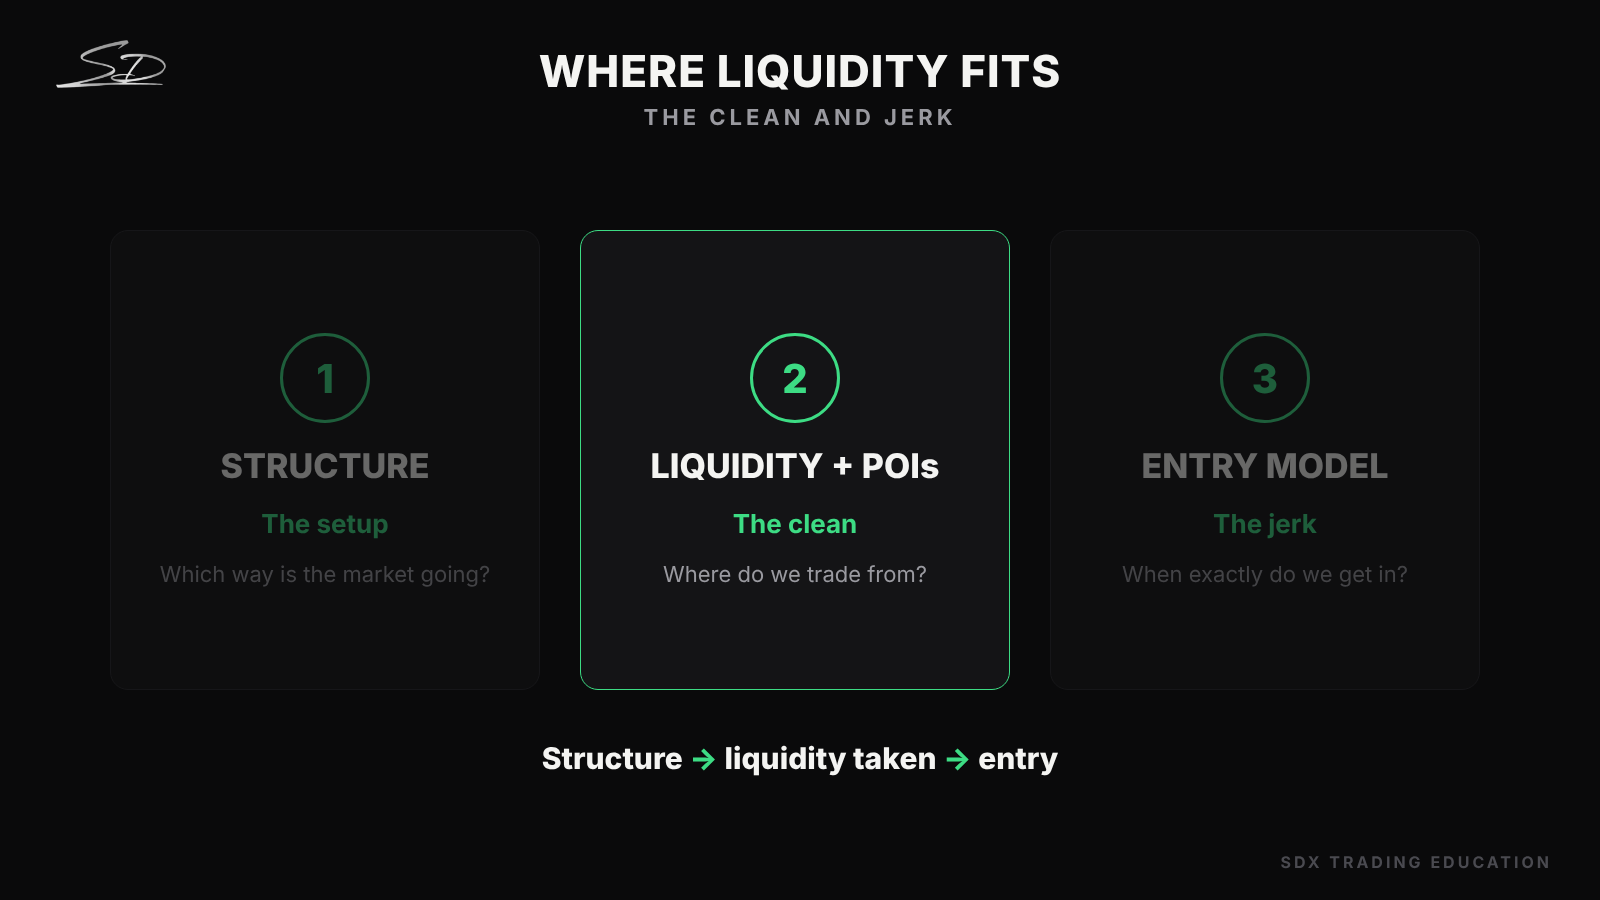
Liquidity is step two of our process.
Structure -> the setup -> tells us which way the market is going
Liquidity and points of interest -> the clean -> show us where price is likely to go and where it’s likely to turn
Entry model -> the jerk -> the exact moment we get in
Structure first, wait for the liquidity to be taken, then look for your entry.
Liquidity Basics
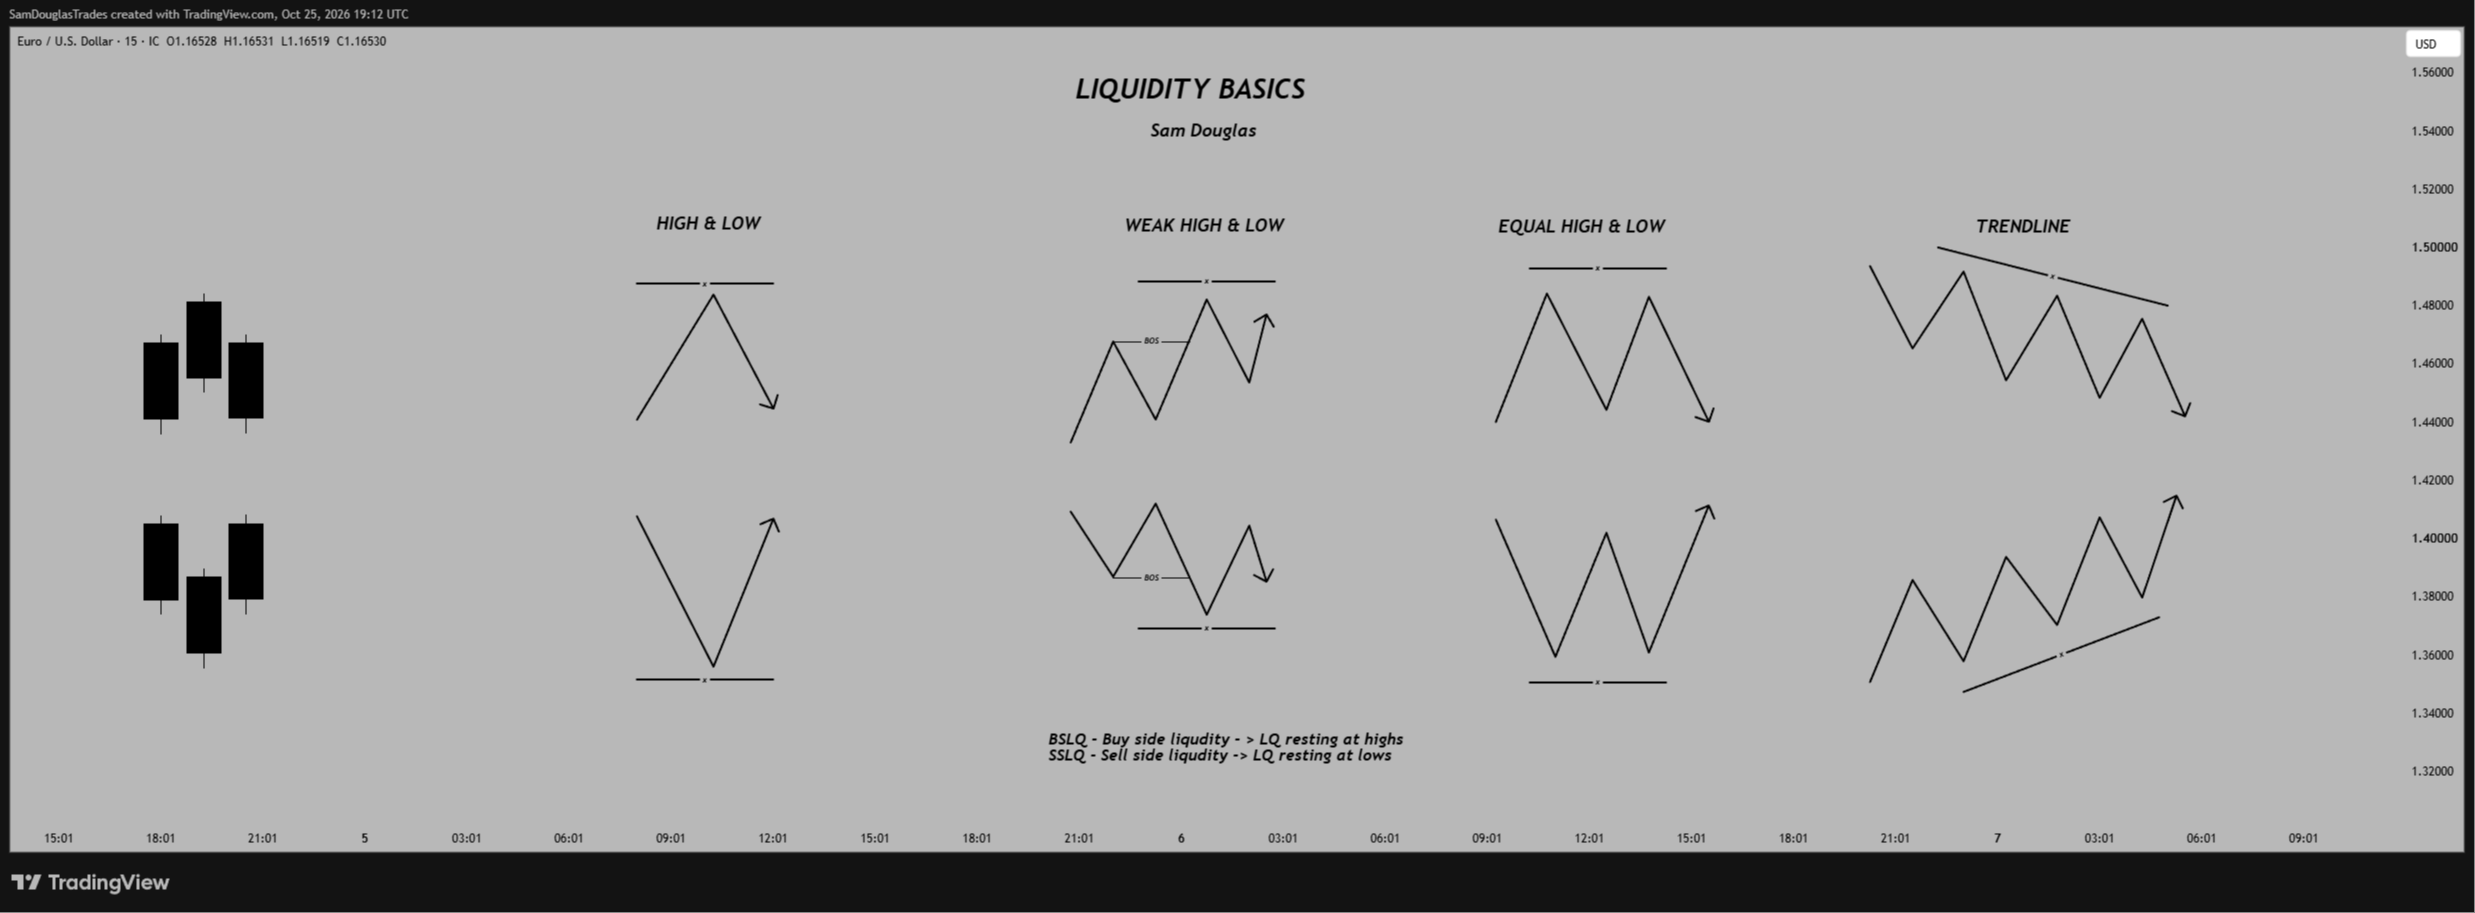
This chart shows the main types of liquidity you’ll see on your chart. Each line marked with an x is where liquidity is resting, the place price is likely to go and take before it makes its next move.
BSLQ -> buy side liquidity -> liquidity resting at highs
SSLQ -> sell side liquidity -> liquidity resting at lows
Candle Highs and Lows -> the simplest form of liquidity. A swing high is when the middle candle has the highest high, and a swing low is when the middle candle has the lowest low. Every one of these has stops sitting just past it.
High & Low -> a clear high or low on the chart. Traders who sell put their stops above the high, and traders who buy put their stops below the low, so liquidity builds up just past them.
Weak High & Low -> the high or low that hasn’t been broken yet after a break of structure (BOS). Price has already shown which way it wants to go, so this is the level price is most likely to come back for and take next.
Equal High & Low -> price hits the same level twice and fails. Beginners see resistance or support and put their stops just past it, which makes this the cleanest liquidity there is.
Trendline -> every time price touches the trendline, more traders jump in on the bounce with their stops just past the line. The more touches, the more liquidity builds up waiting to be taken.
The more obvious the level, the more stops are sitting there, and the more likely price is to take it.
Session Liquidity In Action
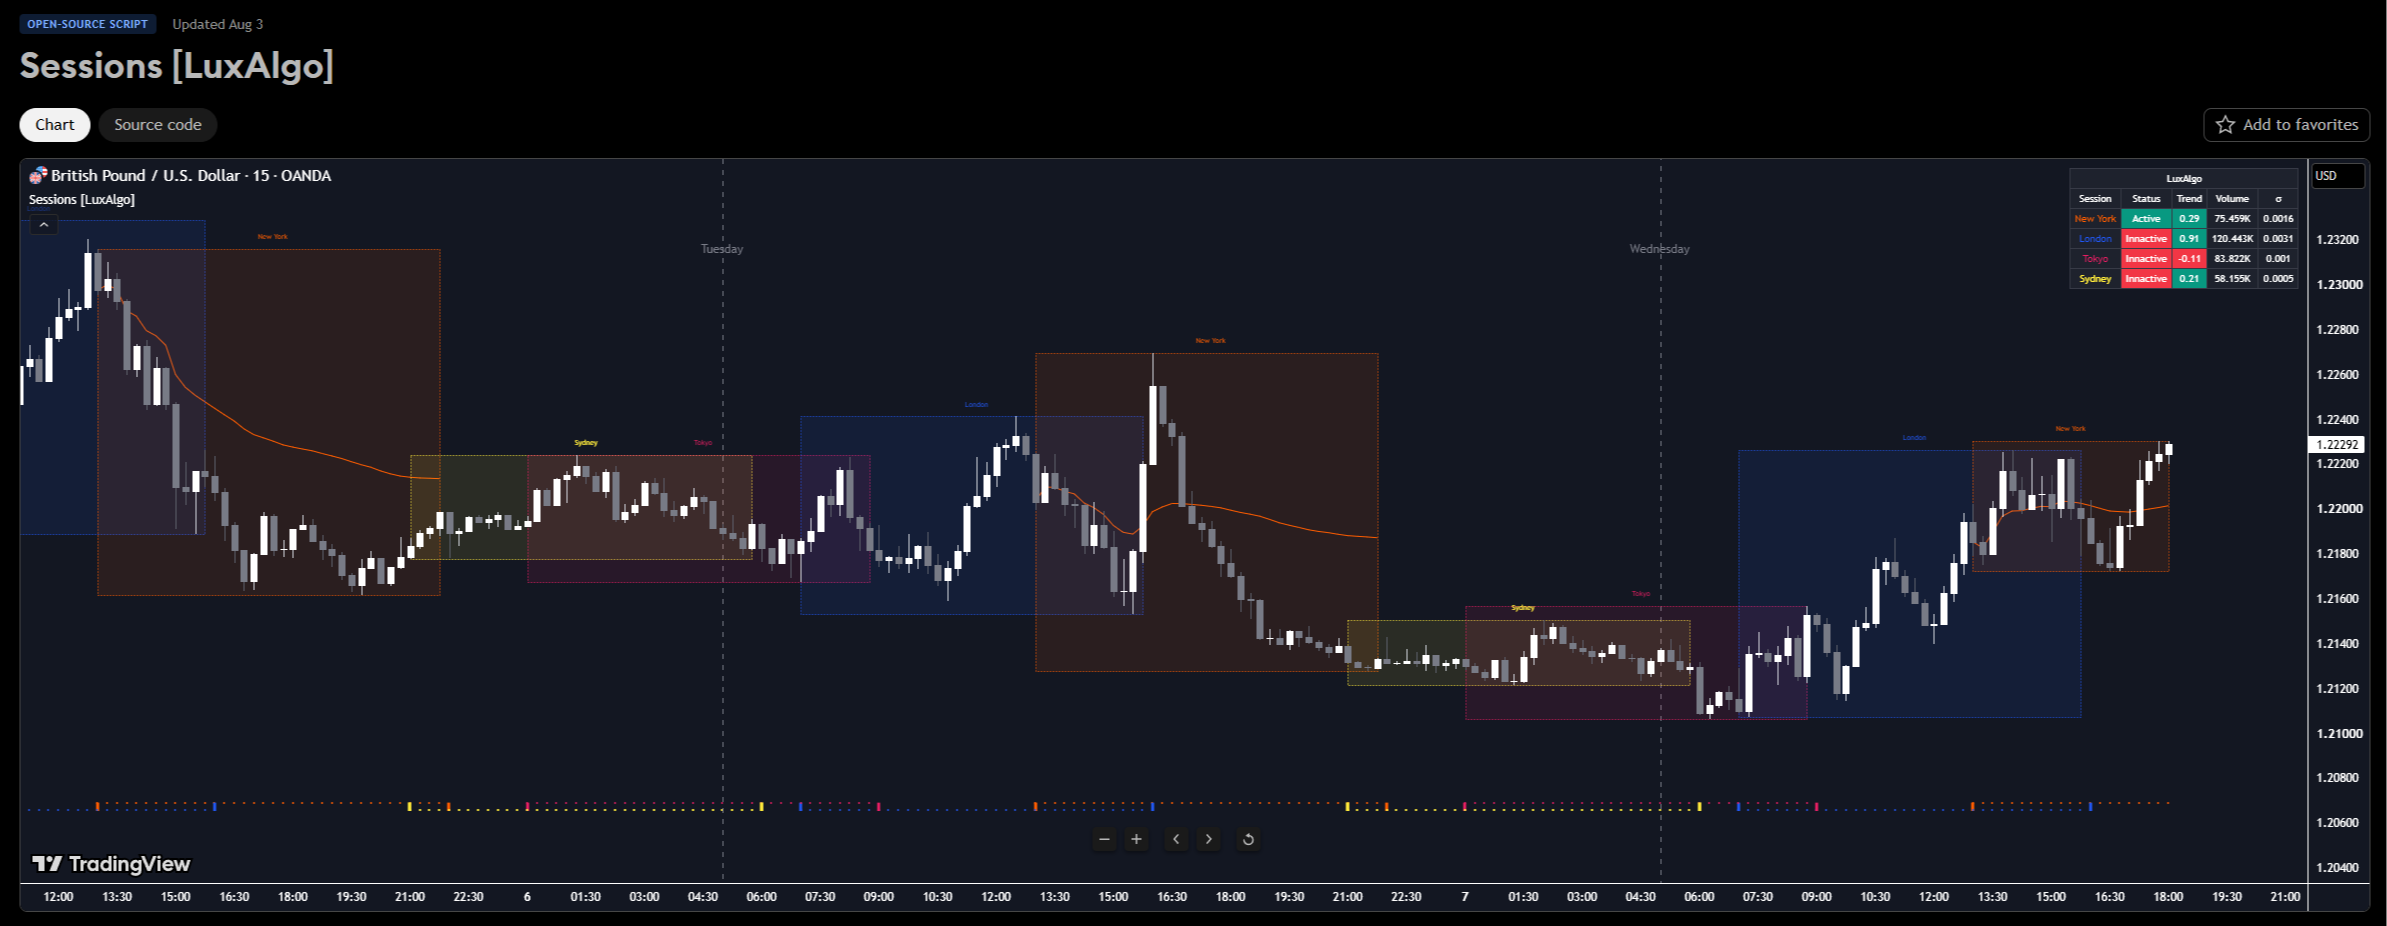
This is EURUSD on the 15 minute chart, with the session boxes turned on and every swing high and low marked with a small arrow. Each of those arrows is a spot where stops are sitting.
October 1st -> a trending day. London broke below the Asia lows and kept dropping, and New York carried the move on, taking out low after low all afternoon.
October 2nd -> a liquidity grab day. Asia built a range overnight, leaving stops above the Asia high and below the Asia low.
London opened and pushed above the highs first, grabbing the buy side liquidity. Then it sold off and swept below the Asia lows, taking the sell side liquidity too.
Once both sides had been taken, New York came in and reversed hard, pushing price straight up through the London high.
Asia builds the liquidity, London and New York come and take it. Mark the session highs and lows every day, then wait for price to take them before you look for your trade.
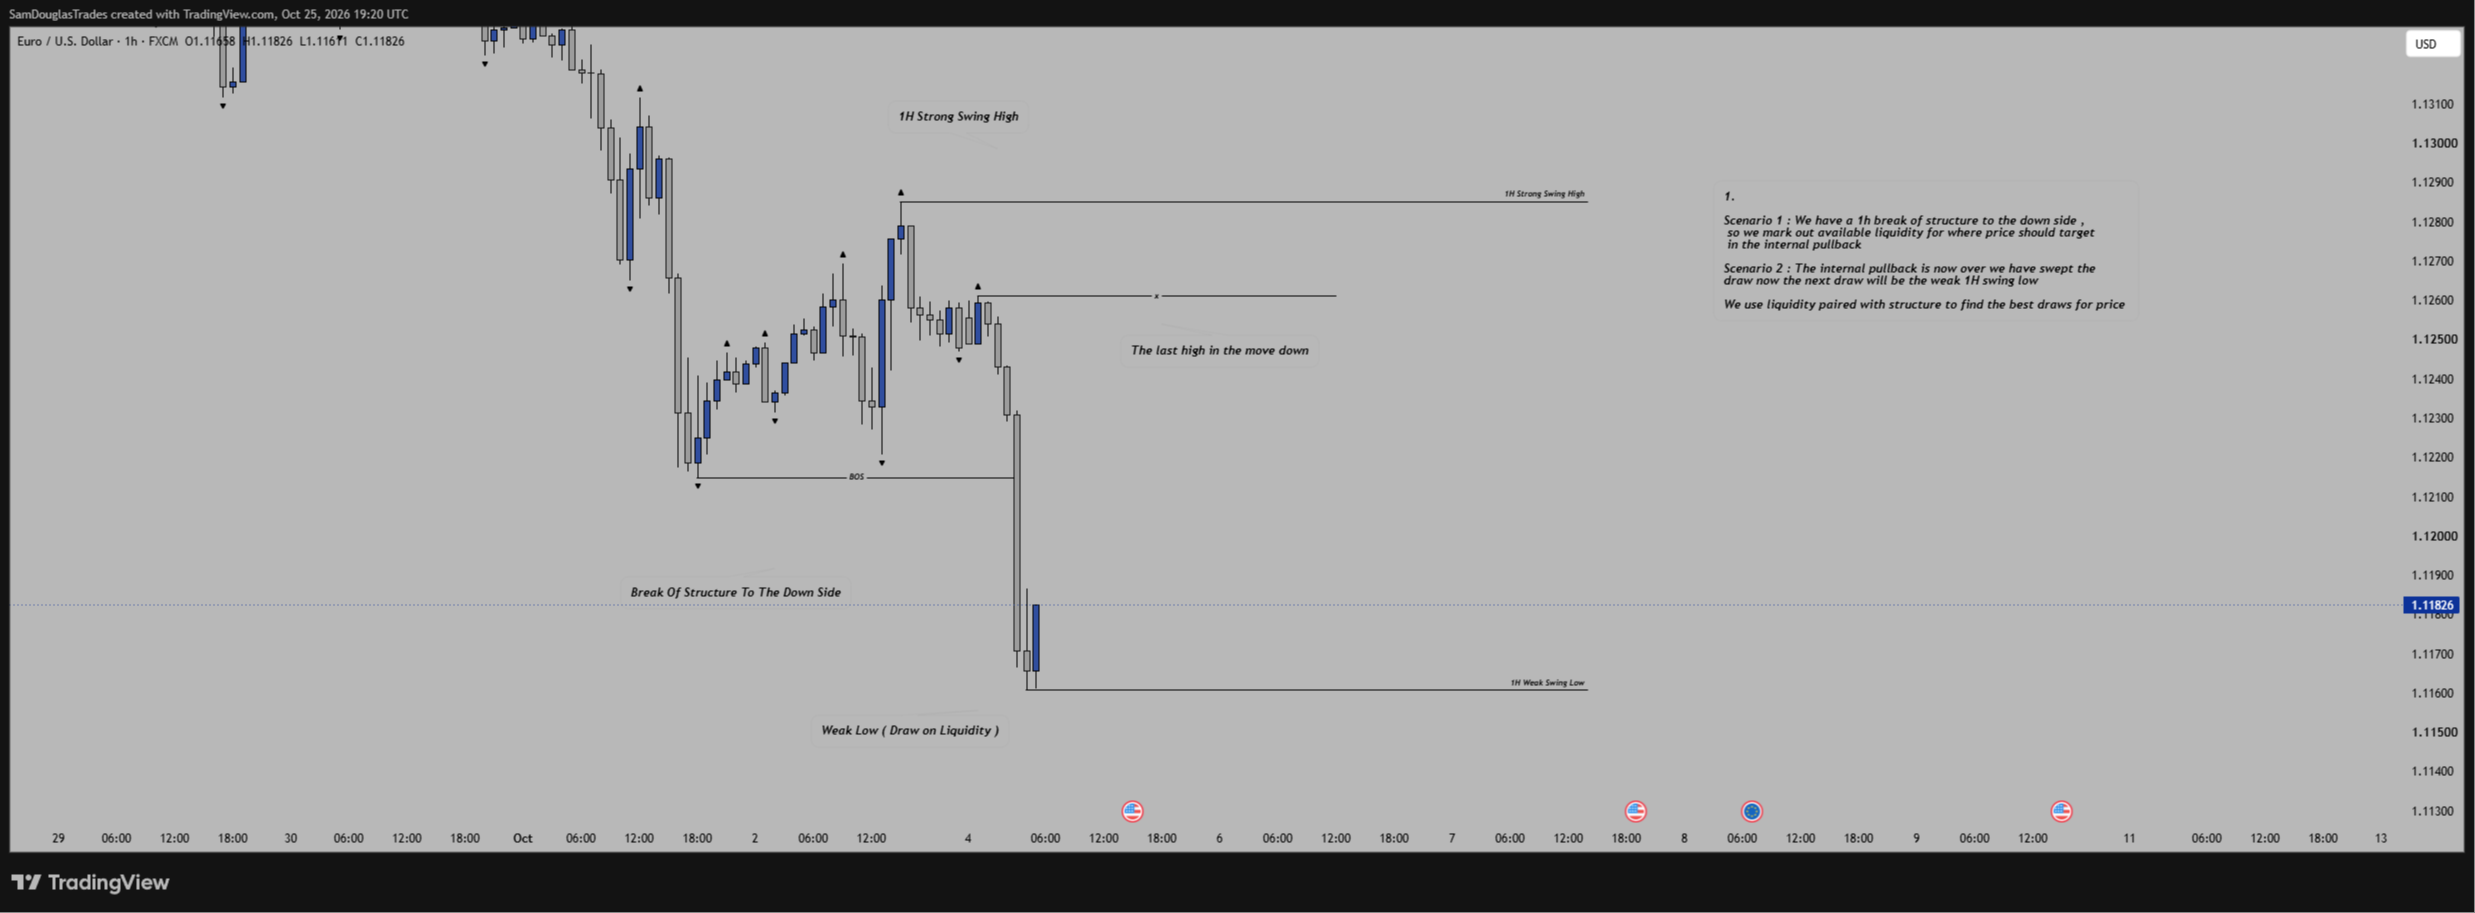
Scenario 1 : We have a 1h break of structure to the down side , so we mark out available liquidity for where price should target in the internal pullback
*We use liquidity paired with structure to find the best draws for price *
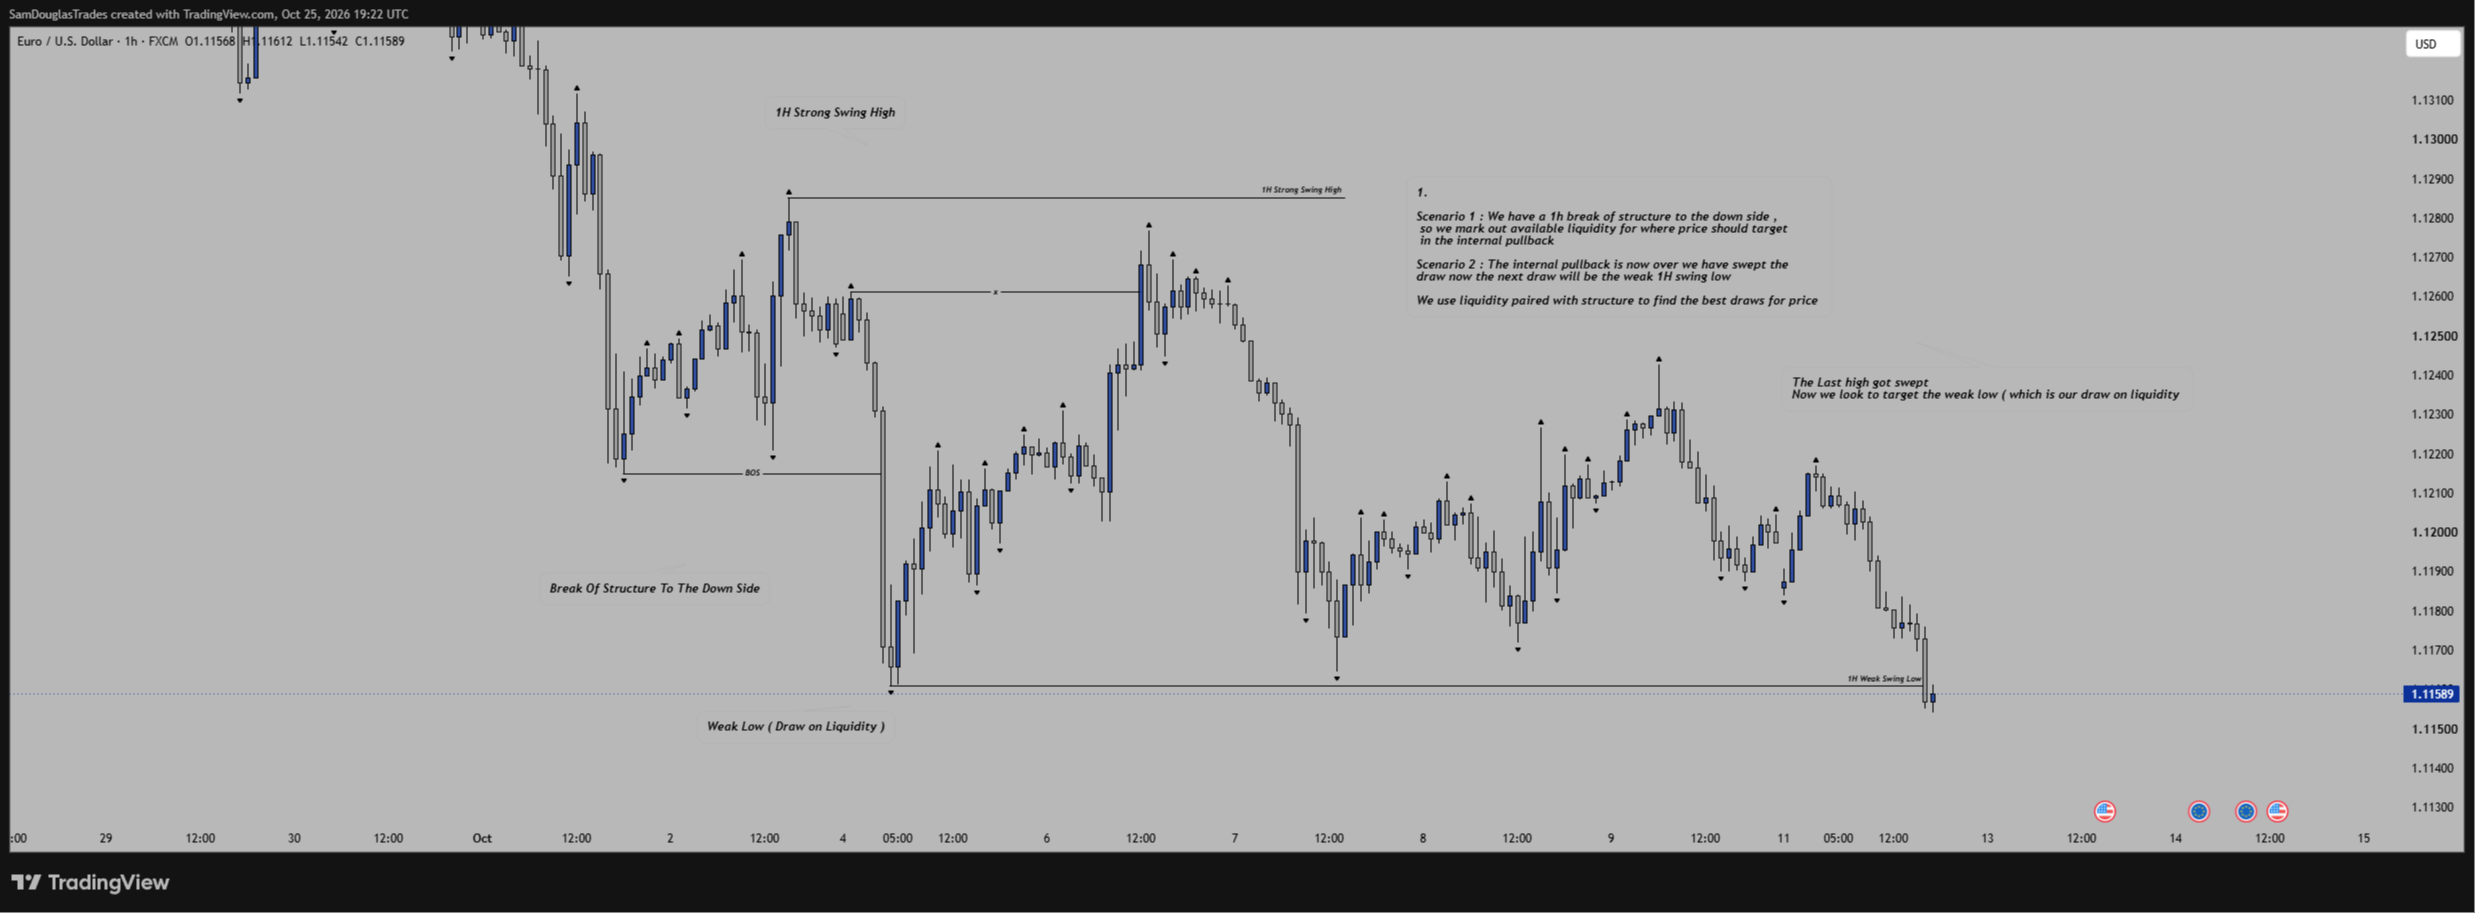
Scenario 2 : The internal pullback is now over we have swept the
draw now the next draw will be the weak 1H swing low
We use liquidity paired with structure to find the best draws for price
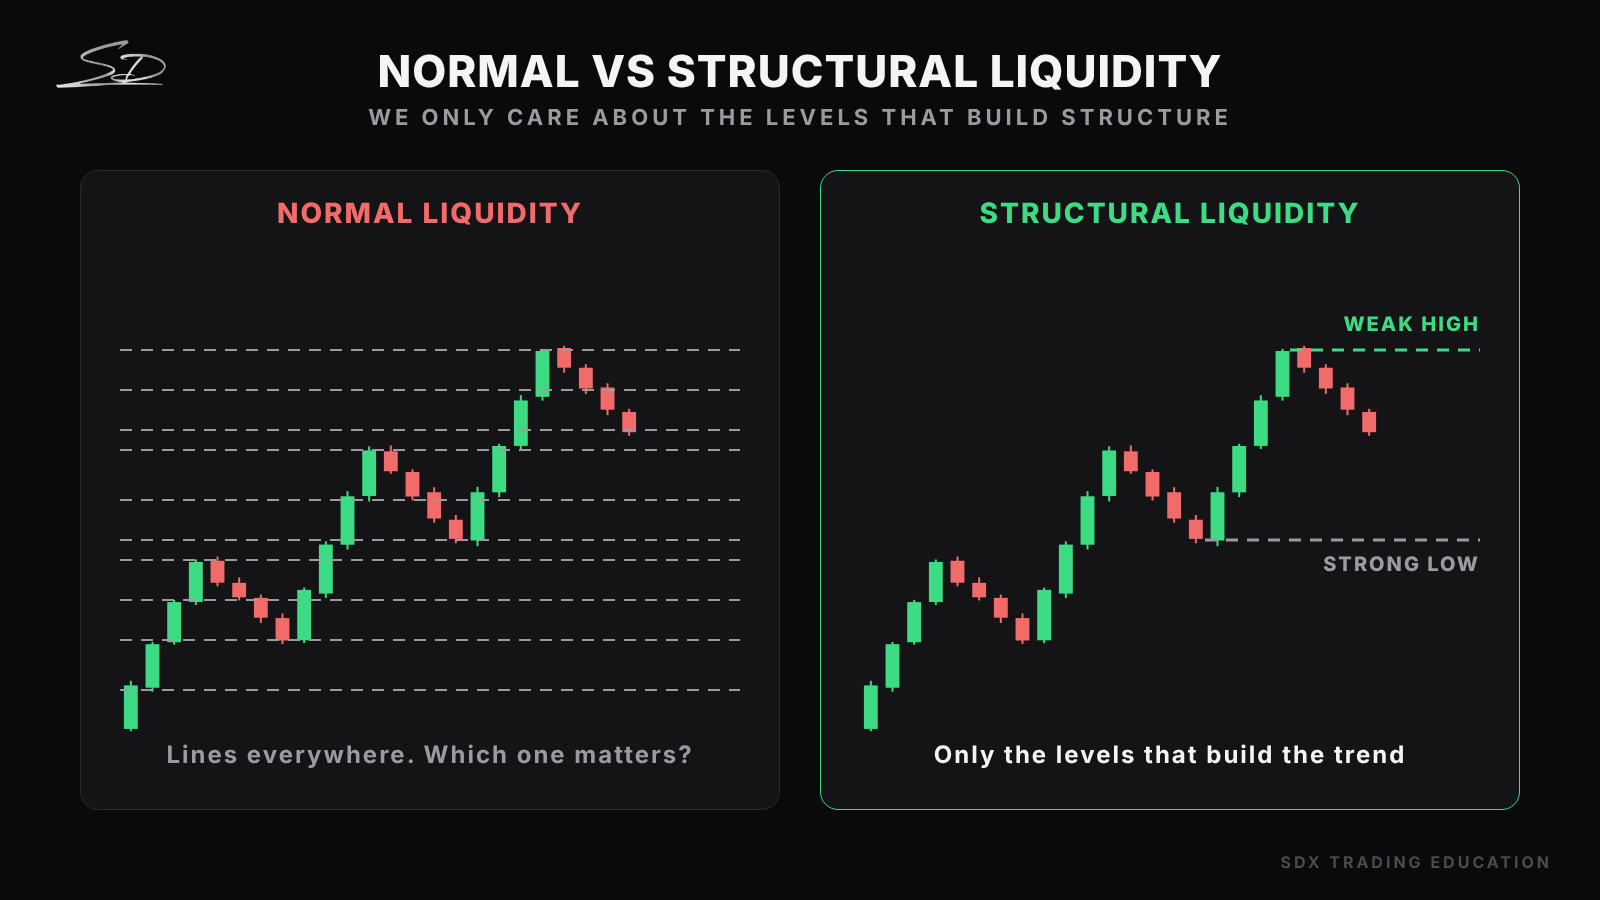
Normal vs Structural Liquidity
Normal liquidity is any high or low on the chart. There are stops above and below all of them, so it tells you nothing about direction. That’s why so many people learn liquidity and still get confused.
Structural liquidity is the liquidity sitting at the swing points that actually build the trend. Because they’re part of the structure, we know which way the market is going, so we know which side price is most likely to take.
Instead of fifty lines on your chart, you’ve got two or three that actually matter.
Normal liquidity tells you where stops are. Structural liquidity tells you where price is going.
Inducement
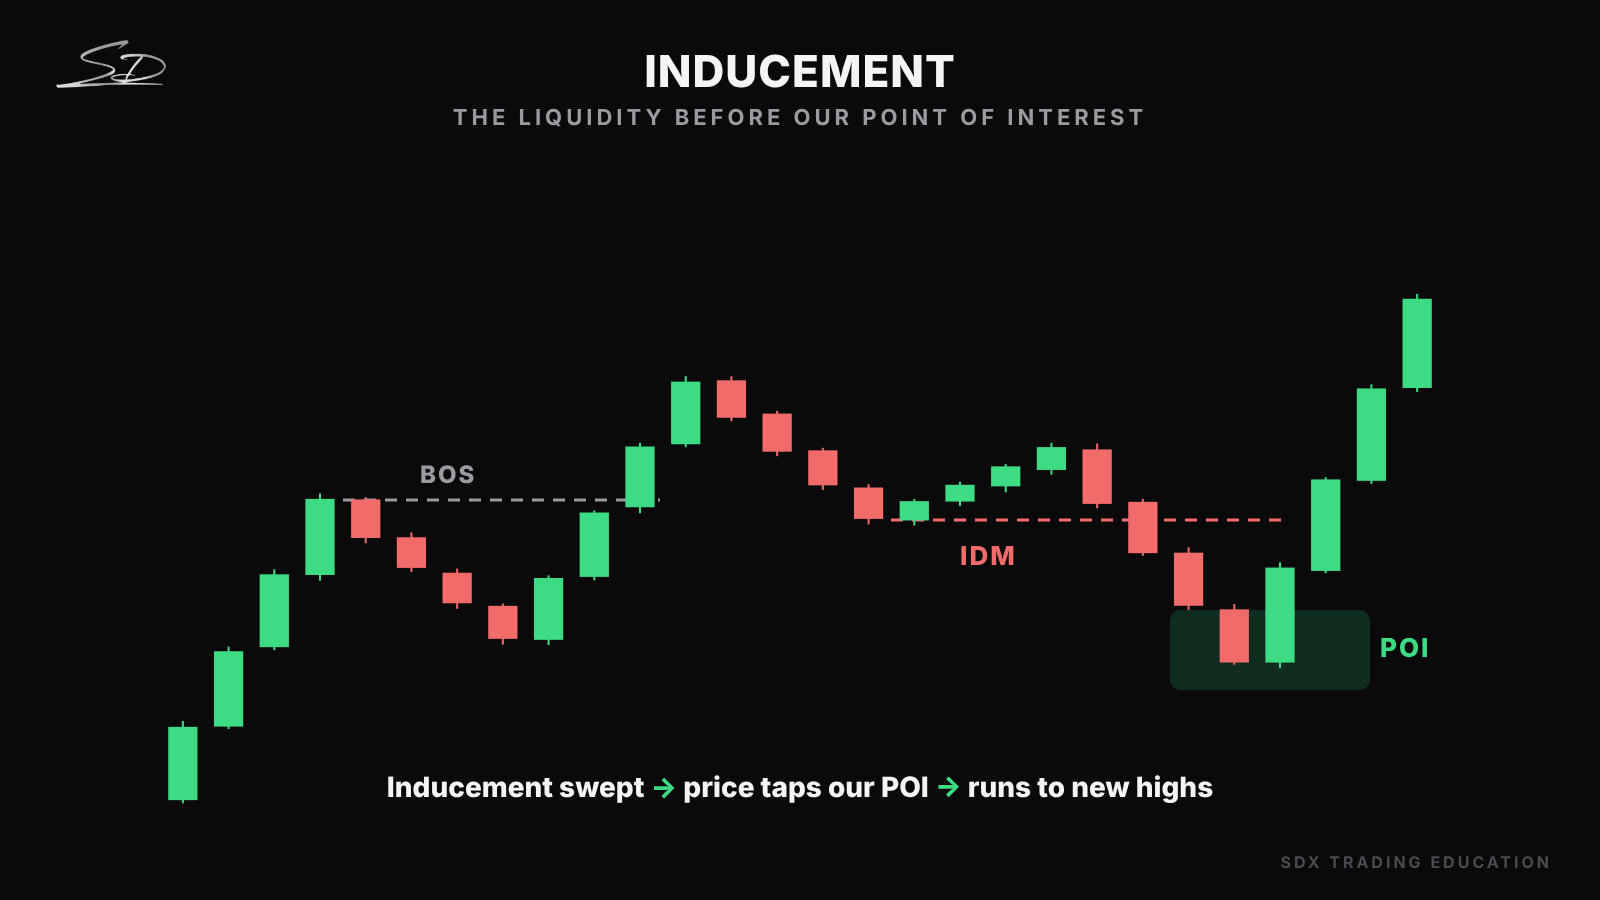
After a break of structure, price pulls back and makes a small early low. Loads of traders see it and buy too early, with their stops just below.
That little low is inducement. It’s liquidity built up right before our real area, literally inducing traders to get in too soon.
Price comes back, takes out the inducement, stops everyone out, and drops straight into our point of interest. From there, it runs to the weak high.
If the inducement hasn’t been taken, we don’t trust the area.